Big Data & Data Analytics: Assignment week 10 "Ego Network" : TWITTER
By looking at the social networks we have, we can know the characteristics of our environment. In Social Network Analysis, Ego Network is a social network that we have, or in other words, social networks with us at the center.
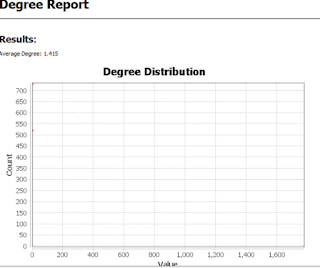 |
| Picture 1: Degree report - degree distribution |
Analysis of the Title Report besides, Statistics in the application in the Average Title section are run, it will produce data as well as that, while the Distribution Title generated in the Online Social Network dataset is 1415. Inside the Average Degree of the maximum data that is appropriate when value 1 has a count of 700 and reaches a value of 550-750, it can be concluded that in the analysis of online social networks it is known which nodes are interconnected (familiar) with other nodes. The darker the node, the more students in the network. After seeing the degree in the network obtained information that is connected directly to many nodes in the network.
 |
| Picture 2: Graph Density Report - betweenness centrality distribution |
Analysis of the Title Report besides, Statistics in the application in the Average Title section are run, it will produce data as well as that, while the Distribution Title generated in the Online Social Network data set is 1415. Inside the Average Degree of the maximum data that is appropriate when value 1 has a count of 700 and reaches a value of 550-750, it can be concluded that in the analysis of online social networks it is known which nodes are interconnected (familiar) with other nodes. The darker the node, the more students in the network. After seeing the degree in the network obtained information that is connected directly to many nodes in the network.
 |
| Picture 3: Modularity Report |
Analysis of the Modularity Report besides, Statistics in the application in the parameters and results are run, it will produce data such as the side, which produces random size and use edge weight in the "on" condition and produces a resolution of 1.0. and also the maximum modularity of the data that is owned and produces the same value 0,000 and resolution as well and produces a number of 1 point continuity, it can be concluded In the analysis of online social network networks have been known anywhere.
 |
| Picture 4a: visualization |
 |
| Picture 4b: Visualization from modularity |
From the data in addition we can analyze after going through the process of degree distribution, betweenness centrality distribution and the size distribution process produces an analysis of tweets of data that are formed from one data to another data that both have the same goal which is to "kucinggawl" and each each data process to be a structured data visualization. From this it can be concluded that by using the three methods that had been done through Gephi, a data can be encapsulated into a data that is equally connected by each process.


Komentar
Posting Komentar