Big Data & Data Analytics: Assignment week 7 "Exercise (RapidMiner)" : GRAB
The Better Performance, The More Profit Grab Company Will Get
Data Flow Diagrams (DFD) are diagrams that use notations to describe the flow of data in a system or explain the work process of a system, the use of which is very helpful for understanding systems logically, structured and clear. In short, DFD is a modeling tool for modeling system workflows.
1. Context Diagram
Describe a large circle that can represent the entire process contained in a system. It is the highest level in DFD and is usually numbered 0 (zero). All external entities are shown in the context diagram along with the main data streams to and from the system. This diagram does not contain any data storage at all and seems simple to create.
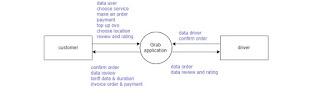 |
| Illustrates the scope, input, and output of the Grab Application |
2. Zero diagram (level-1 diagram)
Is a large circle that represents the small circles in it. Is a solution from Context Diagram to Zero Diagram. This diagram contains data storage.
 |
| Zero Diagram of Grab Application |
3. Detailed Diagrams
Is a diagram that outlines what processes are in the Zero diagram.
Grab is an example of a large online transportation company in Indonesia. In this case, it cannot be denied that they use Big Data in their daily activities in running their business in order to meet customer needs.
The Grab Company rewrites the program code data once every 2 years, this is done because the current program will not be able to function properly in the next few years.
Another thing the Grab developer team is focusing on is how they can utilize the data they get every day. With this data, they can provide warnings when drivers drive recklessly, as well as advise drivers to get close to locations where many users are located.
In addition, Grab also uses their data to find out the movement of people in a city every day. That way, they can provide input to the city government about the best way to overcome congestion. This they have done in Singapore, and is the cause of the emergence of the GrabShare feature.
So, the reason why Grab might use RapidMiner to get the more profits with their increasing performance is:
1. Grab can give a warning to the driver
Because one of the indicators of customer assessment of the company itself can be seen from its drivers, the face of this company also lies in the service provider, one of which is the driver. When the performance performed by the driver is not good (such as reckless, does not use complete attributes, choose a vulnerable route, etc.) then the customer's assessment of the company is also not good. This can affect the number of orders from customers, thereby reducing the profit gained by the company. Conversely, if the performance performed by the driver is very good, then it can remind profit earned by the Grab company itself.
2. Grab can find out the point and time of traffic jams in a city
Grab can find out the movement of people in the city, one of which is about traffic jams, so they can provide advice to the government in handling it. This they have done in Singapore, and is the cause of the emergence of the GrabShare feature.
3. Provide decision predictions, such as providing the fastest route, estimated time to arrive, and costs to be paid by the customer
This is do by the company so that companies can also expand their businesses. Grab can make the right choice for its business for short, medium and long term.
References:


Komentar
Posting Komentar